
Climate change is a real threat to our planet, with destructive consequences already being felt across the globe. Dr. Daniel Duffy, High-Performance Computing Lead at the NASA Centre for Climate Simulation (NCCS) explains how big data is essential to the task of studying climate change.
What kid hasn’t dreamed of being an astronaut? Science and space exploration have always been extremely interesting to me, so working at NASA is not only an honor and a privilege, but a dream come true. Though they have not selected me to be an astronaut – yet – as High-Performance Computing Lead at the NASA Centre for Climate Simulation (NCCS), I work with former astronauts and some of the world’s best scientists and engineers to develop solutions to model climate change.
NCCS provides high-performance computing, storage, and networking resources for large-scale NASA science projects. Many of these projects involve global simulations of the Earth’s weather and climate. These simulations create huge amounts of data; data that is literally too big for the scientists to read through. Therefore, it is increasingly important to provide new methods for analyzing and visualizing the big data sets created by these simulations in order to better understand critical scientific questions such as climate change.
Understanding how the climate is changing and its potential effects across the Earth is an extremely important research question. Performing research on weather forecasts will provide us with more accurate information on extreme weather events, such as hurricanes and strong convective systems that can create tornados, which has a direct impact on both the U.S.A. and the rest of the world.
Big Data — Opportunity or Threat?
“Big Data offers a new perspective on reality, and therefore will affect and shape all sectors of our economy, especially those that play a role in the capturing and/or relaying of data and information. But Big Data’s likely impact is broader than the economy; it affects how our societies make sense of the world, and decide important policy challenges, and as you will read, innovation.” Extract from GSR 2014 Discussion Paper, ‘Big Data — Opportunity or Threat?’ Read full article here.
Big Data and Climate Change: How does it work?
Big data and studying climate go hand-in-hand; you really cannot study climate without large amounts of data.
The NASA Centre for Climate Simulation (NCCS) facility is home to a cluster of computers called the Discover supercomputer. Its primary objective is to provide the necessary high-performance computing and storage environment to meet the requirements of NASA science projects. A variety of different science projects are being executed on Discover, with a large portion of those compute and storage resources being used by weather and climate research.
Discover is a high-performance computer specifically designed for extremely large-scale, tightly coupled applications – a system in which the hardware and software are linked and dependent on one another. Even though Discover is not used to collect data from remote sensing platforms such as satellites, many of the atmospheric, land, and ocean simulations that are being run on Discover require observational input. Scientists using Discover are constantly pulling in observational data from all over the globe to be used as input into their models.
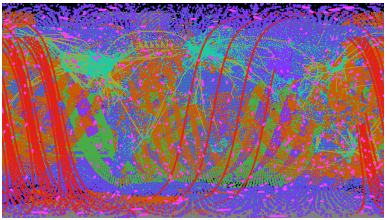 However, providing a large amount of data to a scientist means nothing if they are not able to visualize and map it in meaningful ways. One example of this is the enhanced animation produced by NASA’s Global Modelling and Assimilation Office (GMAO), which uses observations from multiple sources to drive weather forecasts.
Image: Will McCarty, NASA GSFC
GMAO’s GEOS-5 Data Assimilation System (DAS) blends observational and model information to produce the most accurate and physically consistent picture of the atmosphere at any given time. Over five million observations are accumulated every six hours, mapping variables such as temperature, water, wind, surface pressure, and ozone. Assimilated observations come in eight major types, each measuring different variables from various sources.
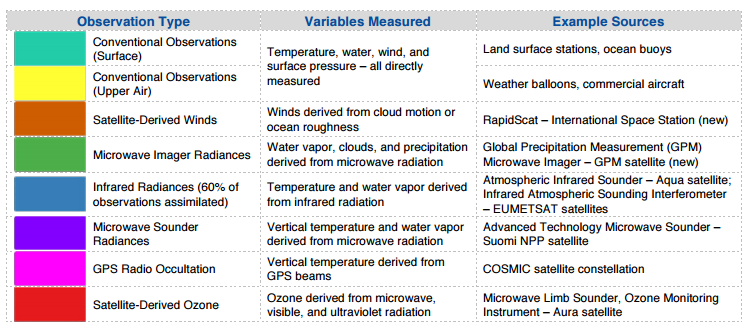
Image: NCCS
Big Data, Big Deal, Big Challenge
“The big data phenomenon — emerging technological capabilities for solving huge complex tasks — has been hailed by industry analysts, business strategists and marketing pros as a new frontier for innovation, competition and productivity. (…) While no precise definition exists, four common characteristics help to describe big data — volume, velocity, variety and veracity. (…) Analysing more data in shorter spaces of time can lead to better, faster decisions in areas spanning finance, health and research.”
Extract from ITU News article, Big Data, Big Deal, Big Challenge. Read full text here.
Big Data: Big Today, Normal Tomorrow
The Technology Watch report Big Data: Big today, normal tomorrow, looks at different examples and applications associated with the big data paradigm, describes their characteristics, identifies the commonalities among them, and highlights some of the technologies enabling the upsurge of big data. As with many emerging technologies, several challenges need to be identified and addressed. Global standardization can contribute to addressing these challenges and will help companies enter new markets, reduce costs and increase efficiency. Read the full report here.
Processing the Data
Climate change models need an ever-increasing amount of computational resources with large amounts of memory and fast access to data. To meet these requirements, Discover is composed of several different types of processors: 79,200 Intel Xeon cores, 28,800 Intel Phi cores, and 103,680 NVIDIA Graphical Processing Unit (GPU) CUDA cores.
The total computational capability for Discover is 3.36 petaflops, or 3,694,359,069,327,360 floating-point operations every second. To get a better understanding of this size of computational power, every living person on Earth would have to multiply two numbers together, every second for almost 140 hours straight to do the equivalent of what Discover can do in one second.
In addition to computational power, Discover has about 33 petabytes of disk storage space. A typical home hard drive is one terabyte in size; therefore, Discover has the equivalent of 33,000 of those hard drives. If this was used to store music, you could create a playlist that was over 67,000 years long without listening to a song twice.
The NCCS tries to upgrade Discover every year. As the servers and storage within Discover age, it actually becomes more efficient after four or five years to replace than it does to continue to operate certain equipment. For example, the 2010 Discover upgrade was replaced in late 2014, early 2015 with an upgraded computational cluster. Within the same floor space, power, and cooling envelope, the NCCS was able to provide approximately eight times the compute capability after the upgrade. The decommissioned equipment is frequently repurposed, either internally for support and other services, or to external sites such as universities including the University of Maryland, Baltimore County (UMBC) and George Mason University (GMU).
Data Mapping: Climate Change and Forecasting
The data generated within the NCCS contributes to a variety of key research and policy papers.
This data enables a more informed conversation on the impacts of climate change on our planet, and can help policy makers develop appropriate strategies and actions in response to climate projections. For example, the data has been used in the assessment reports sponsored by the Intergovernmental Panel on Climate Change (IPCC). A data simulation produced in the NCCS and visualized by NASA’s Scientific Visualization Studio, presents outputs from climate models produced in the IPCC’s Fifth Assessment Report, showing how temperature and precipitation are projected to change throughout the 21st Century.
We also generate a reanalysis of the climate over the past 35 years that is used in a variety of projects outside of NASA.
Hurricane Katrina, which hit the U.S. Gulf Coast in 2005, highlights the importance of accurate forecasting. Though damage was immense, it could have been far worse without the forecasts to provide advanced warning and allow time for adequate preparations. Today, NCCS supercomputers hosts GMAO’s global circulation model, which is up to 10 times the resolution of those used during Hurricane Katrina, allowing for a more accurate look inside the hurricane helping to more accurately estimate its intensity and size. This means that meteorologists have a better understanding of where a hurricane is going and what activity is happening inside, which is essential to planning successful preparations for an extreme event like Katrina.
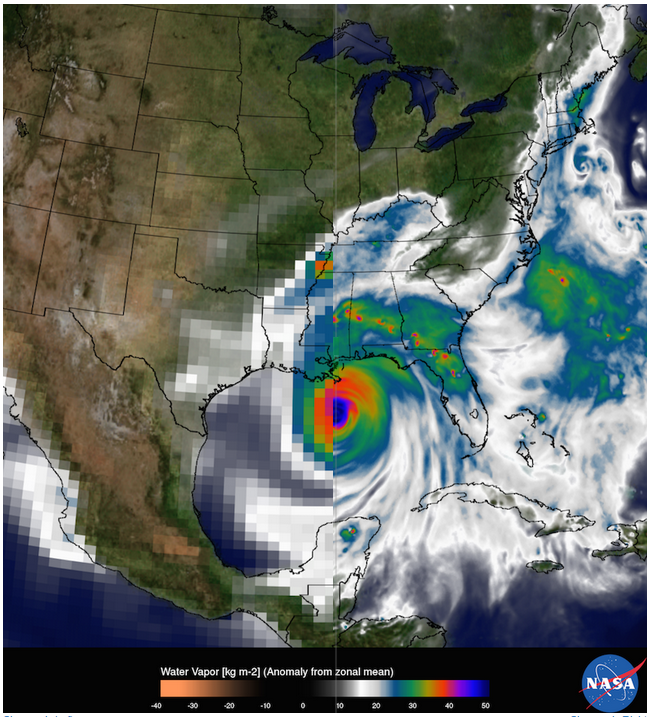
In addition, the output of the global climate models is also used by Observing System Simulation Experiments (OSSEs) to simulate the next generation of remote sensing platforms being proposed by NASA. This provides scientists and engineers with a virtual Earth in which to study the benefits of making new remote observations of the atmosphere from space prior to even building a new sensor or satellite.
Image: Each image shows water vapor within Hurricane Katrina on Aug. 29, 2005, but at different resolutions. The left image is at 50-km resolution, the resolution of most global models in 2005. The right image shows a 2015 version of the Goddard Earth Observing System model, Version 5 (GEOS-5) at 6.25-km global resolution. NASA Goddard Space Flight Center/Bill Putman
Adapting ICT Infrastructures to Cope with Climate Change
“We are only now beginning to understand how climate change is impacting our world. It is changing the lives of every one of us, and research suggests that these impacts are likely to accelerate in the future. There are many practical steps we can take to adapt to climate change, and new research points to the fact that information and communication technologies (ICT) will also have to adapt in the face of global climate change.” Extract from ITU blog, ‘Adapting ICT Infrastructures to Cope with Climate Change’. Read the full article here.
Connect 2020
Goal 3: Sustainability
 The new Connect 2020 agenda, which sets out the vision, goals and targets that ITU and its Member States have committed to achieve by 2020. Connect 2020 includes two ambitious targets directed at reducing the environmental footprint of the ICT sector: Reduce volume of redundant e-waste by 50% by 2020; Greenhouse Gas emissions generated by the telecommunication/ICT sector to be decreased per device by 30% by 2020.
The Future of Climate Change Data
The primary product of NASA is data. Satellites, instruments, computers, and even people may come and go out of NASA, but the data – especially observations of the Earth – will be valuable forever. Therefore, it is critical for NASA to provide access to the data it generates, and not just to other NASA sites and scientists, but to the world.
The sheer size of data being generated is a huge challenge. Even now, it is difficult for scientists on the systems to use the data sets, much less for someone outside of NASA to obtain the data for their use. Therefore, we have started to look at creating a Climate Analytics-as-a-Service (CAaaS), which combines high-performance computing, data, and application programming interfaces (APIs) to provide interfaces to analysis programs that run in situ with the data. In other words, rather than downloading huge data files, users can ask the questions that they are interested in and the analysis will be run on NASA systems. The result of that analysis will then be returned to the user. Because the size of the resulting analytics is smaller than the size of the raw data needed to generate it, this system will reduce the amount of data transferred over a variety of variety of networks, and more importantly, APIs can be made such that it dramatically reduces the friction between users and data.
ITU Talks: Big Data
Best-selling author and leading academic, Viktor Mayer-Schönberger’s ITU Talk on Big Data explored the hottest trend in technology and the dramatic impact it will have on the economy, science and society at large. Watch his ITU Talk here.